Shipping’s carbon density shows signs of improvement, says IMO study
페이지 정보
작성자 최고관리자 댓글 0건 조회 1,470회 작성일 21-04-09 16:14본문
|
|
|
|
대용량 첨부 파일2021-03-29 ~ 2021-04-05 |
대용량 첨부 파일은7일간보관 |
Shipping’s carbon density shows signs of improvement, says IMO study
IMO published the Fourth IMO GHG Study Executive Summary( 첨부참조). The study estimates that total shipping emitted 1,056 million tonnes of CO2 in 2018, accounting for about 2.89% of the total global anthropogenic CO2 emissions for that year.
Emissions | 26/03/21
This study is the first iteration since the adoption of the Initial IMO Strategy on Reduction of greenhouse gas (GHG) Emissions from Ships in 2018, under which IMO Member States have pledged to cut GHG emissions from international shipping and to phase them out as soon as possible.
Under a new voyage-based allocation method, the share of international shipping represented 740 million tonnes of CO2 in 2018.
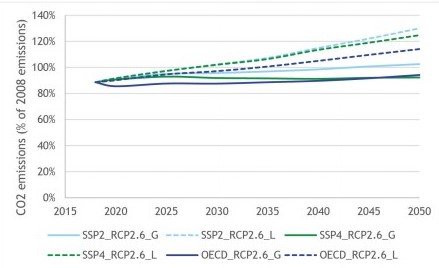
According to a range of plausible long-term economic and energy business-as-usual scenarios, shipping emissions could represent 90-130% of 2008 emissions by 2050.
In addition, for the first time, the study includes estimates of carbon intensity. Overall carbon intensity has improved between 2012 and 2018 for international shipping as a whole, as well as for most ship types. The overall carbon intensity, as an average across international shipping, was between 21 and 29% better than in 2008.
The Study demonstrates that whilst further improvement of the carbon intensity of shipping can be achieved, it will be difficult to achieve IMO’s 2050 GHG reduction ambition only through energy-saving technologies and speed reduction of ships. Therefore, under all projected scenarios, in 2050, a large share of the total amount of CO2 reduction will have to come from the use of low-carbon alternative fuels
IMO said.
More specifically, the study found the following:
Emissions inventory
The greenhouse gas (GHG) emissions of total shipping have increased from 977 million tonnes in 2012 to 1,076 million tonnes in 2018 (9.6% increase). In 2012, 962 million tonnes were CO2 emissions, while in 2018 this amount grew 9.3% to 1,056 million tonnes of CO2 emissions.
The share of shipping emissions in global anthropogenic emissions has increased from 2.76% in 2012 to 2.89% in 2018.
Under a new voyage-based allocation of international shipping, CO2 emissions have also increased over this same period from 701 million tonnes in 2012 to 740 million tonnes in 2018 (5.6% increase), but to a lower growth rate than total shipping emissions, and represent an approximately constant share of global CO2 emissions over this period (approximately 2%).
Using the vessel-based allocation of international shipping taken from the Third IMO GHG Study, CO2 emissions have increased over the period from 848 million tonnes in 2012 to 919 million tonnes in 2018 (8.4% increase).
Due to developments in data and inventory methods, this study is the first IMO GHG Study able to produce greenhouse gas inventories that distinguish domestic shipping from international emissions on a voyage basis in a way which, according to the consortium, is exactly consistent with the IPCC guidelines and definitions.
Projecting the same method to 2008 emissions, this study estimates that 2008 international shipping GHG emissions (in CO2e) were 794 million tonnes.
Carbon intensity 2008, 2012 – 2018
Carbon intensity has improved between 2012 and 2018 for international shipping as a whole, as well as for most ship types. The overall carbon intensity, as an average across international shipping, was 21 and 29% better than in 2008, measured in AER and EEOI respectively in the voyage-based allocation. In fact, it was 22 respectively 32% better in the vessel-based allocation.
Improvements in carbon intensity of international shipping have not followed a linear pathway and more than half have been achieved before 2012. The pace of carbon intensity reduction has slowed since 2015, with average annual percentage changes ranging from 1 to 2%.
Annual carbon intensity performance of individual ships fluctuated over years. The upper and lower quartiles of fluctuation rates in EEOI of oil tankers, bulk carriers and container ships were around ±20%, ±15% and ±10% respectively.
Quartiles of fluctuation rates in other metrics were relatively modest, yet still generally reaching beyond ±5%. Due to certain static assumptions on weather and hull fouling conditions, as well as the non-timely updated AIS entries on draught, actual fluctuations were possibly more scattered than estimated, especially for container ships
according to the study.
Emission projections 2018 – 2050
Emissions are projected to increase from about 90% of 2008 emissions in 2018 to 90-130% of 2008 emissions by 2050 for a range of plausible long-term economic and energy scenarios.
Emissions could be higher than projected when economic growth rates are higher than assumed here or when the reduction in GHG emissions from land-based sectors is less than would be required to limit the global temperature increase to well below 2 degrees centigrade.
Although it is too early to assess the impact of COVID-19 on emission projections quantitatively, the study says that it is clear that emissions in 2020 and 2021 will be significantly lower.
Depending on the recovery trajectory, emissions over the next decades may be a few percent lower than projected, at most. In all, the impact of COVID-19 is likely to be smaller than the uncertainty range of the presented scenarios.
Credit: IMO
- 이전글intertanko - COVID charter party issues 21.04.09
- 다음글타사사고사례) MSC mega container ship in serious trouble 21.04.09


